Nitrogen Monitoring
Two crucial questions farmers want to know through the growing season:
When should I apply Nitrogen?
How much Nitrogen should I apply?
Enter Nitrogen Monitoring, which visualizes soil information and accumulated precipitation to predict how much Nitrogen will be left on a field at VT/R1, a critical corn growth stage.
My Responsibilities: Product design, native mobile & web; generative research; usability testing
My Team: Product Manager, Engineering Manager, Engineering Team, QA
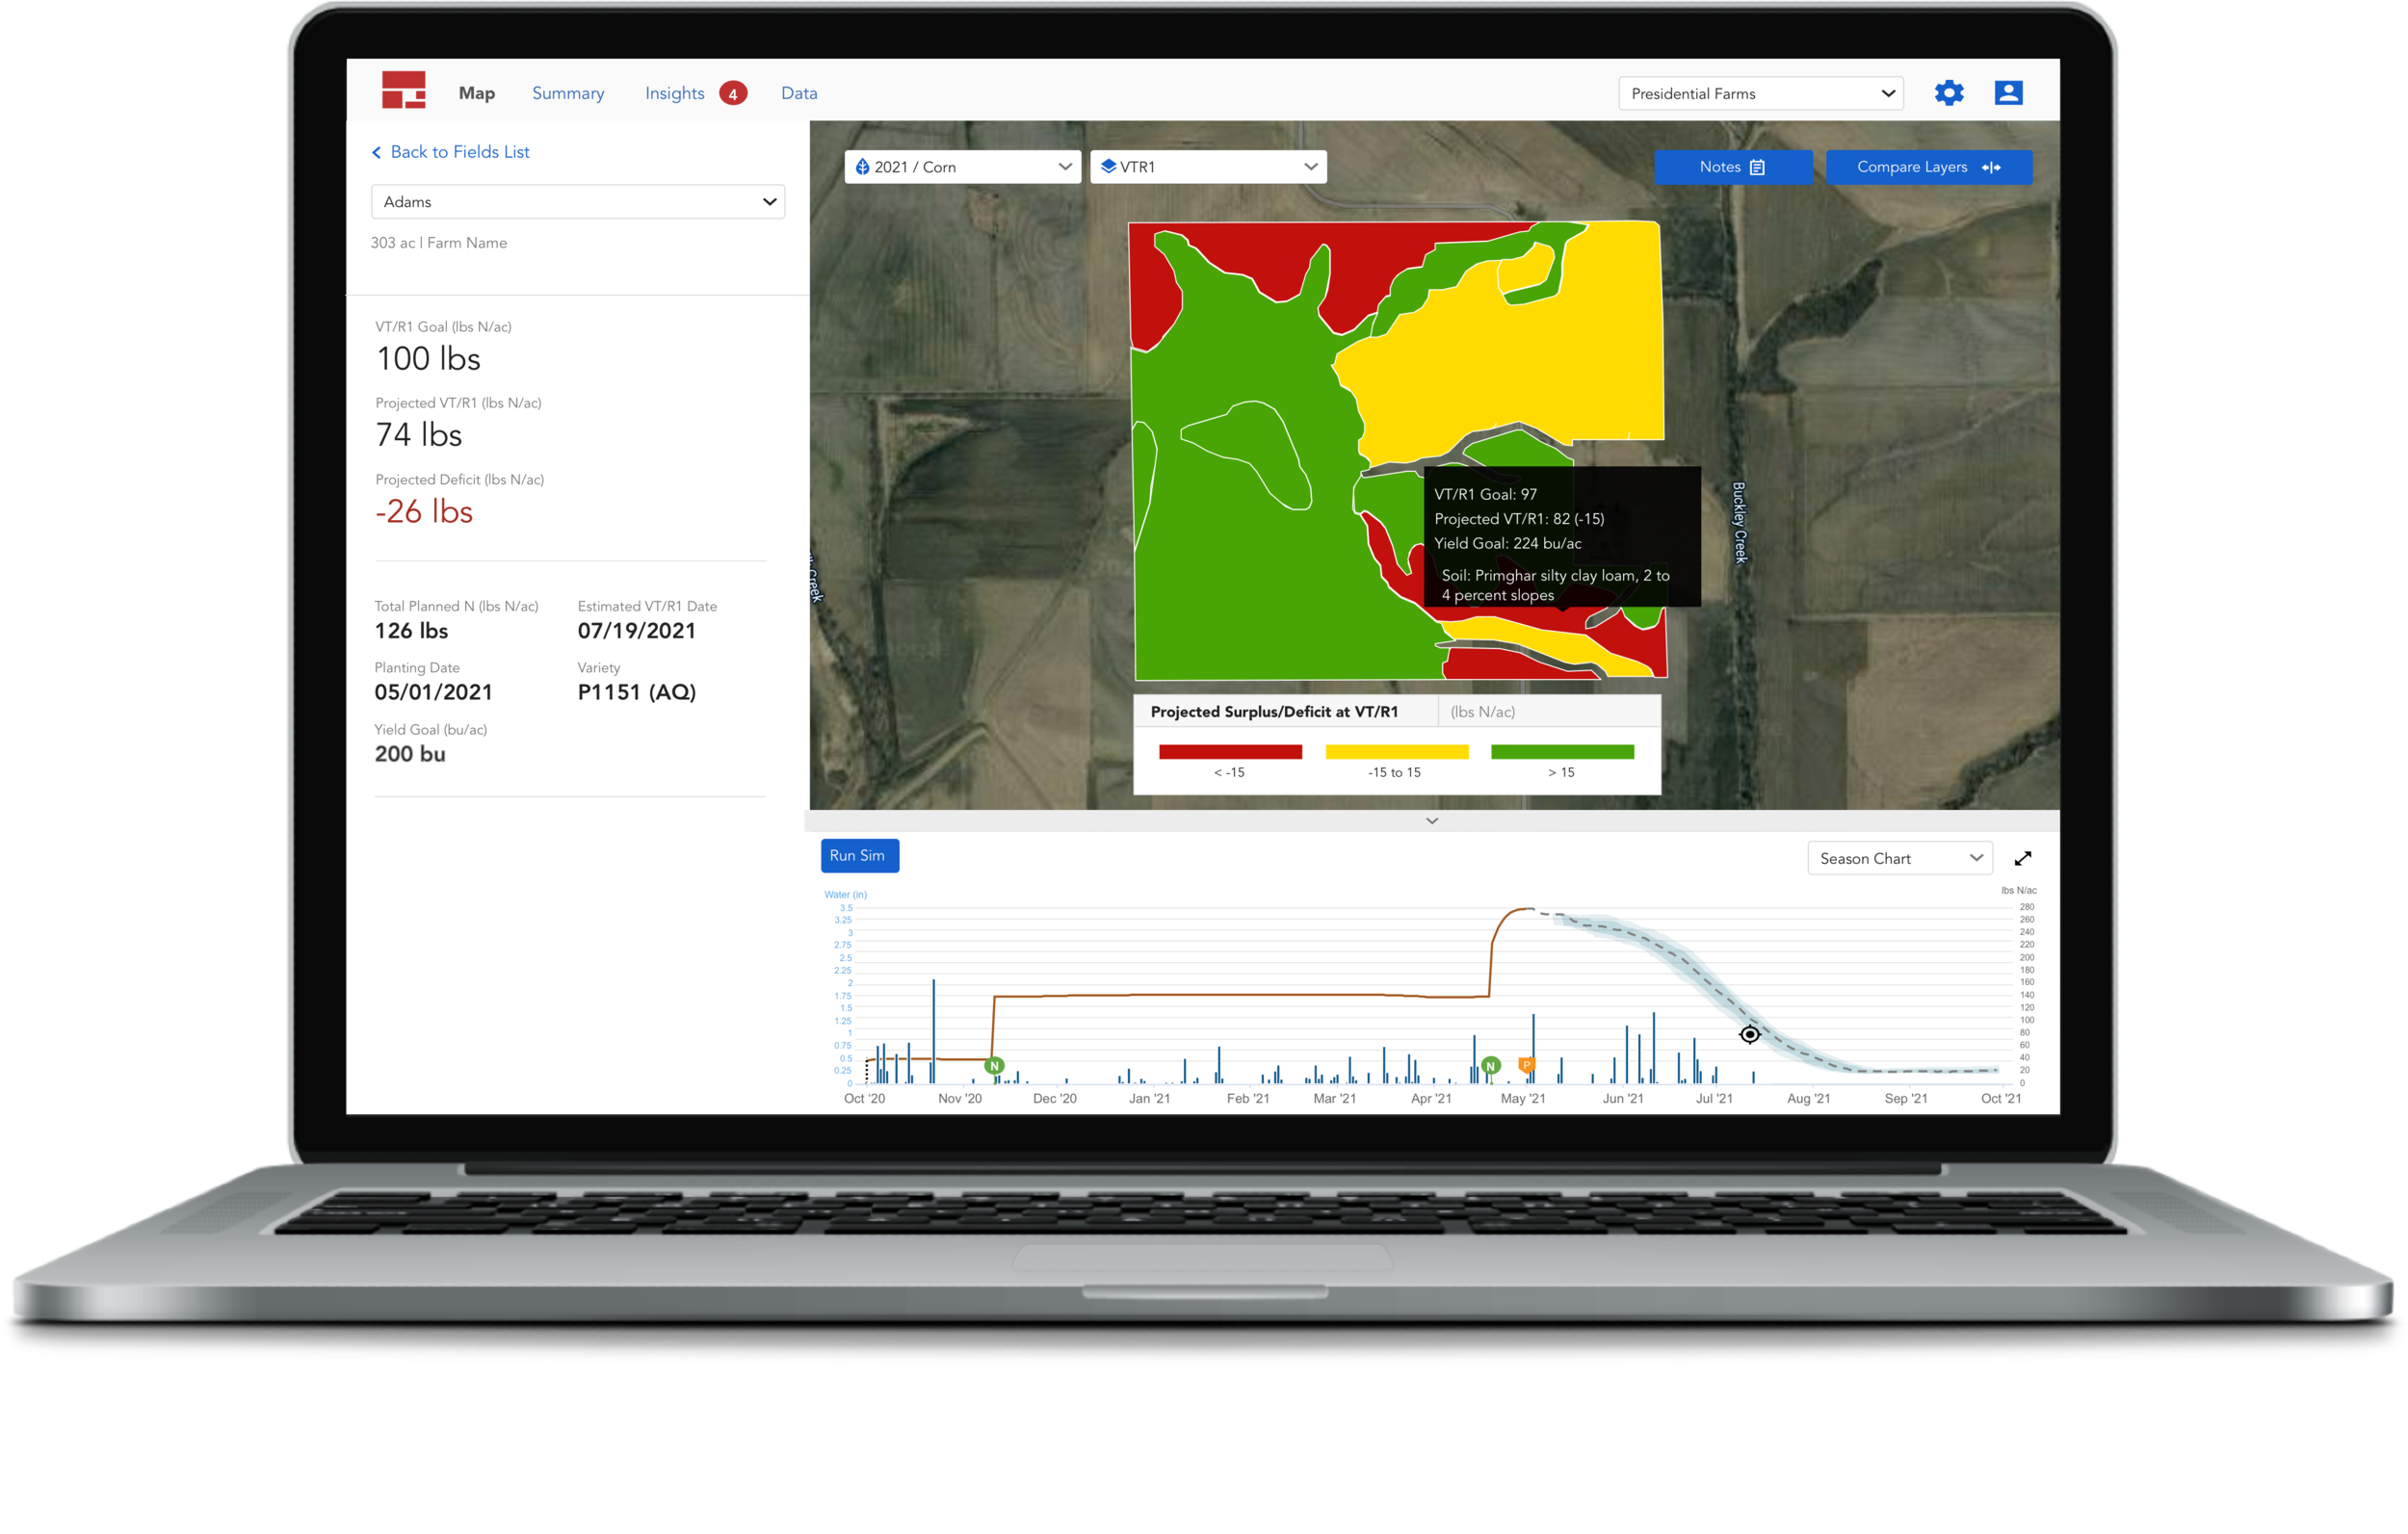

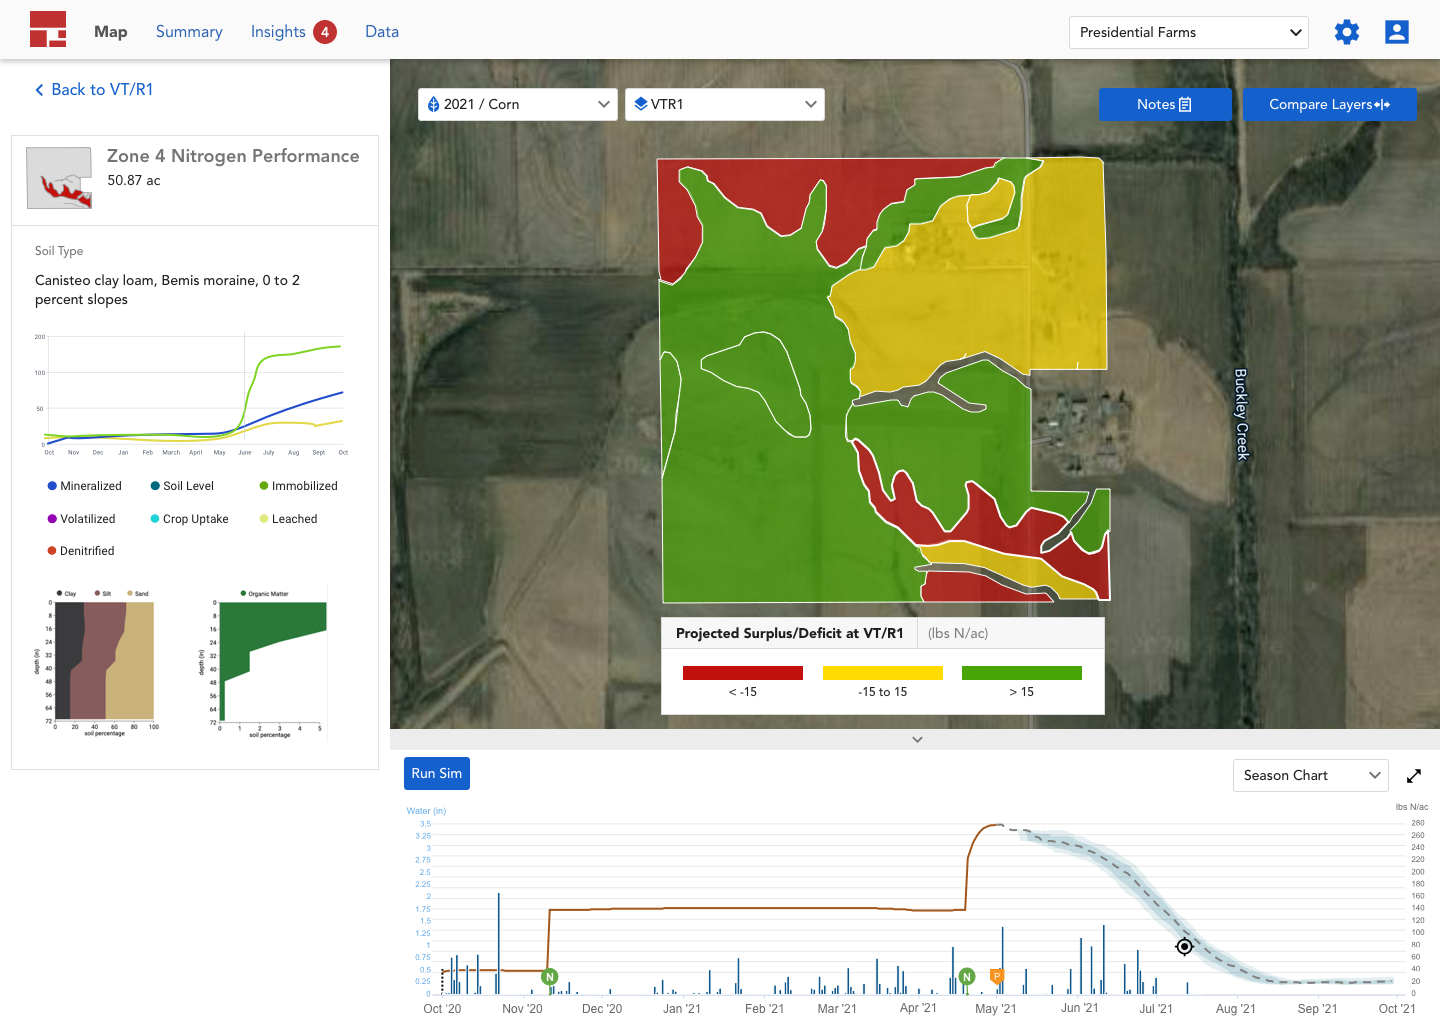
Monitoring Nitrogen requires agronomists to reference multiple variables (soil, weather, uptake, mineralization, leaching, and more!) to better understand why a field is over-performing or under-performing in terms of Nitrogen health.
During interviews, we observed that the old features required agronomists to constantly switch back and forth between UIs to reference this information, making it time consuming to take action.
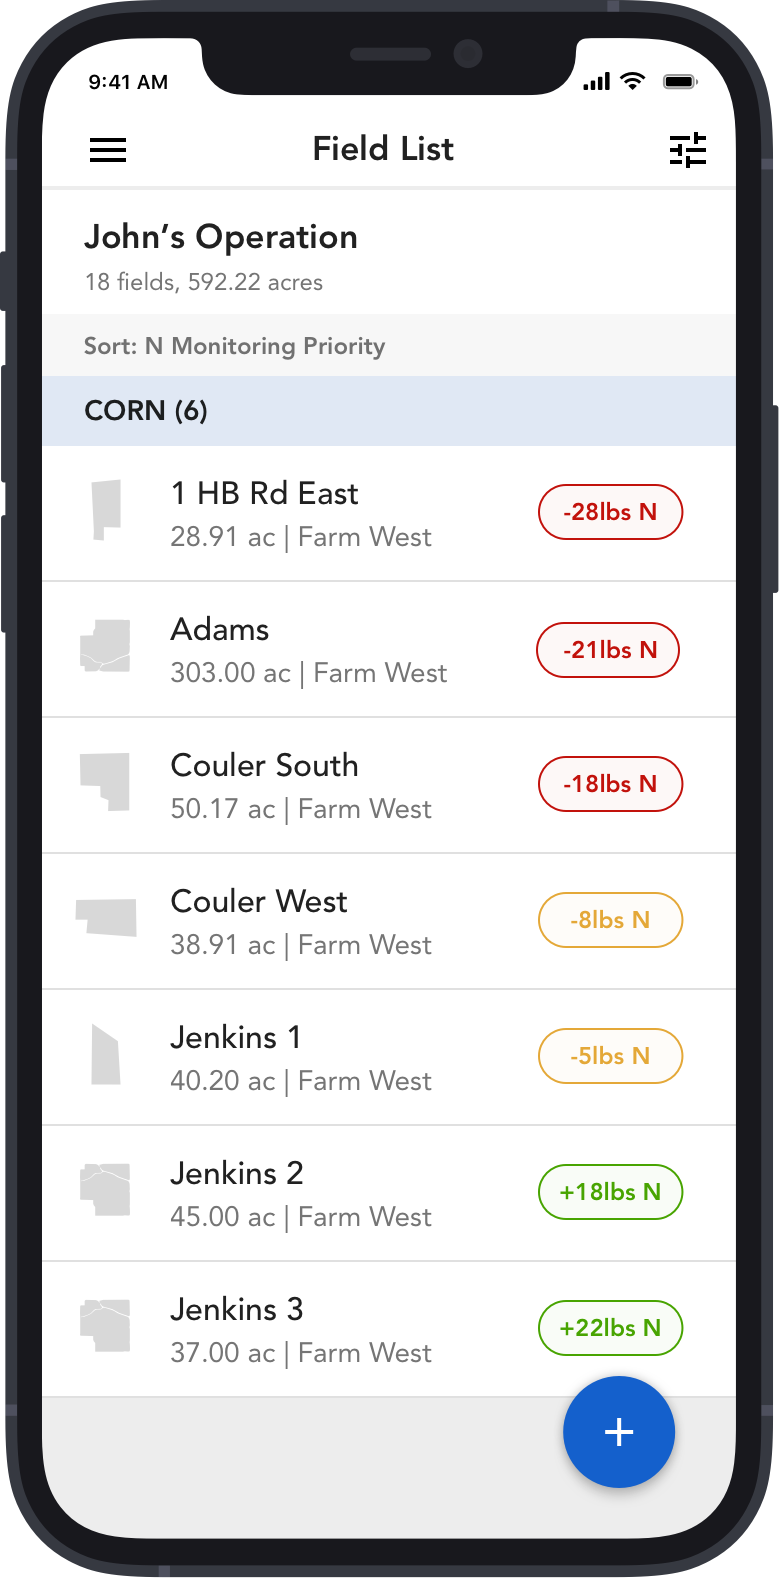
Users also struggled to understand which of their fields needed their immediate attention for Nitrogen applications. Knowing whether or not a field is deficient in Nitrogen can translate to a 50% increase in yield.
Summary of Work + Findings
After completing user interviews, I worked on a number of concepts to ease cognitive load and add value to our users’ understanding of Nitrogen levels on their fields. Once we completed usability testing, we zeroed in on two important improvements:
A user experience that allows people to reference all necessary valuable information they need in a single, helpful UI.
A new ranking system, Nitrogen Monitoring Priority, that provides users with quick, actionable feedback regarding which fields need their attention.
Users gave us overwhelmingly positive feedback on this new feature via our biannual PVS survey. Unfortunately, the feature was shelved due to a shift in business priority.